
Problem: I need to generate a bell curve in Excel. The mean is 50 and the standard deviation is 12. (In the formulas below, substitute your real mean and standard distribution for the 50 and 12.)
Strategy: You curve needs to start three standard deviations below the mean. Follow these steps:
- In cell A2, enter =50-12*3
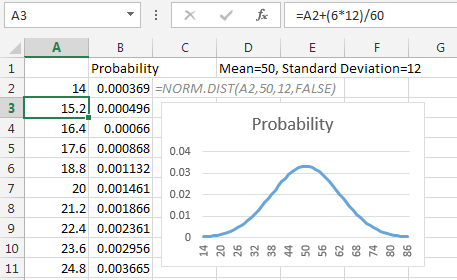
- In cell A3, enter =A2+(12*6)/60
- Copy A3 down to A4:A62. This gets you 61 data points; 30 on either side of the mean.
- In cell B2, enter =NORM.DIST(A2,50,12,FALSE). Copy that to B3:B61.
- Enter a heading in B1, such as Probability
- Select A1:B62. Insert a Line chart.
- A couple of formulas will generate a bell curve in Excel.
Additional Details: With a Normal distribution, 99.8% of the probability falls within 3 standard deviations of the mean. The formula in A2 starts 3 standard deviations below the mean. Experience has taught me that using 61 data points is enough to create a fairly smooth curve. Thus, the formula in A3 is designed to cover six standard deviations over the course of 60 more rows.
The real workhorse here is the NORM.DIST function. You have to plug in the mean and standard deviation for the desired bell curve to make it work.