
The previous chart showed revenue by Region. In the Axis dropdown, add two more fields: State and City. In the chart, double-click on the West region to have the chart change to show states in the west region. Double-click California to see all of the cities in California. To go back up a level, a new Drill Up icon appears at the top right of the chart.
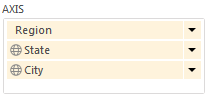
- Create a hierarchy
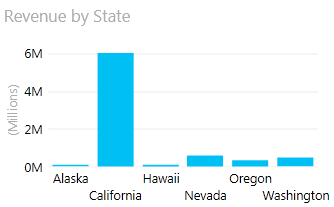
- Double-click any column to drill down.