
Maybe you want to plot quality performance in a manufacturing plant. Or which displays in a retail store generate the highest sales. The 2015 edition of Power Map lets you replaced the Globe with any alternate map image.
The first step is to get a 2-dimensional image of your floor plan.
Using Photoshop or another tool, figure out the X and Y points of various locations on the image. Be careful, because Photoshop measures the Y position from the top of the image, while Excel XY Scatter charts measure the Y location from the bottom of the image. If you know the height of the image, it is easy enough to label the first column PhotoShopY and then build a real Y column of =Height-Photoshop Y.
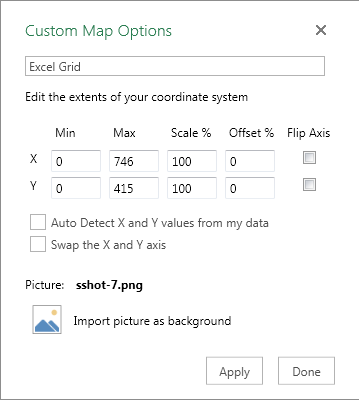
As you add the data to Power Map, declare those fields to by X and Y. Click on Custom Map and fill out this dialog.
Do not let Excel figure out the X and Y values (unless you have a data point in the each corner of the image.) Fill in the exact pixel width and height in pixels. If you did not calculate the Height-Y, you can use Flip Axis for the Y.
Upload your picture.
The result is a flat map where you can use the navigation keys to fly through your shop floor, examining the quality scores.
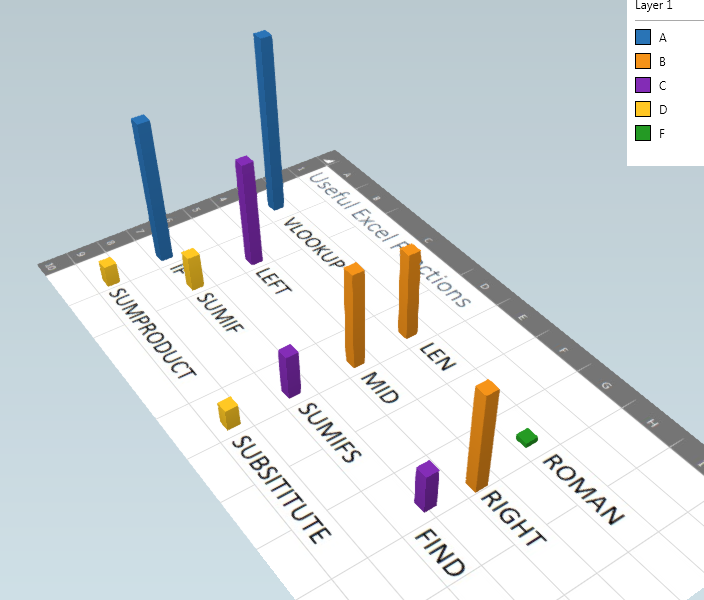
- My "shop floor" is Excel"¦.