
Problem: My data has subtotals that cause spikes in the chart.
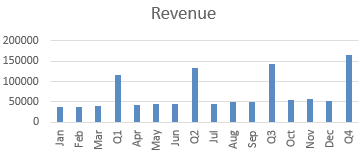
- Charting data with subtotals does not look good.
Normally, you would create another range with the monthly data and create a chart from that range. But, Excel 2013 introduces the Funnel icon to the right of the chart. Click the Funnel and you can uncheck certain data points.
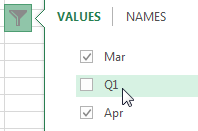
- Remove each Quarter from the chart.
The result: a monthly chart:
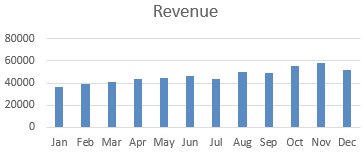
- No more spikes.