
Problem: I have a large spreadsheet with many calculations. Results from section 1 are carried forward to cells in section 2. It would help to graphically illustrate that one cell flows to the calculation of another.
Strategy: You can use the Shapes feature to add arrows to indicate the flow of cells. Here's how you use it.
- Select Insert, Shapes dropdown and choose an arrow.
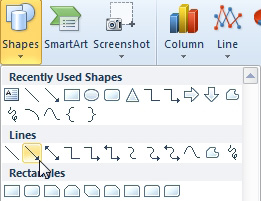
- Shapes are in single menu now.
- Click in the origin cell and drag to the final cell. When you release the mouse button, an arrow will appear, pointing from the first cell to the end cell. Annoyingly, the shape is drawn in a light shade of the first theme color, which ends up as light blue in the Office theme.
- While the arrow is still selected, open the Shape Styles gallery on the Drawing Tools Format ribbon tab. Select one of the black styles in an appropriate thickness.
- You can further control the arrow using the Shape Outline dropdown on the Format ribbon. Use the Weight, Dashes, or Arrows flyout menus. There are even more options available by pressing Ctrl+1 with the arrow selected.
- By default, the arrow will resize with the cells. Say that the arrow stretches from column E to column C. If you make column D wider, the arrow will stretch. To turn off this behavior, right-click the arrow and choose Size and Properties. You can then decide if the shape should move, resize, and/or print.
Additional Details: Any line in the Shapes gallery can become an arrow. You might need to draw a curved arrow.
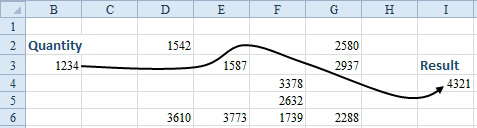
- This is a curve with an arrow added later.
- If you need to draw a curved arrow, choose the Curve icon in the Shapes gallery.
- Click at the starting point (i.e. the non-arrow side) of the line.
- Start drawing with the mouse. Any where that you need the line to change direction, click the mouse and keep drawing. To draw this curve, you would click the mouse at each point shown.
- The black handles show the mouse click locations.
- When you reach the endpoint of the line, double-click.
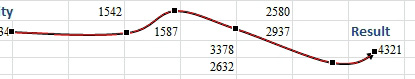
- With the line selected, go to the Shape Outline dropdown on the Format ribbon tab. Choose an arrow from the Arrows dropdown. Choose a darker color. Choose a heavier weight.
If you later need to edit the curves in the line, right-click the line and choose Edit Points. In Edit Points mode, when you click a point, you can move that point, or move one of the two white diamond handles to change the arc of the curve.
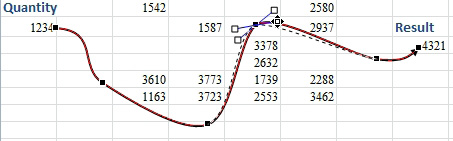
- Edit the points of the curve.