
Problem: I need to illustrate a circular process in which information can flow in both directions. Which SmartArt type should I use?
Strategy: You should use the Multi-directional Cycle chart. This is the only one of the diagram types that offers bidirectional arrows between the blocks. This chart type is the sixth thumbnail in the Cycle category.
Some other types of charts require you to select certain SmartArt types. The following are some examples.
To accommodate extremely long sentences of Level 2 text, your choices are the Vertical Box List, Vertical Bullet List, and Vertical Chevron List charts. These are in the List category.
To make a decision between two choices, use a Balance chart from the Relationship category. This clever type will lean left or right, depending on which choice has more Level 2 items.
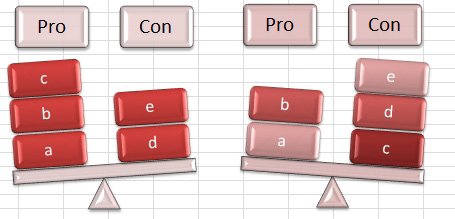
- The Balance chart leans left or right, depending on content.
To show how parts add together to produce an output, you use an Equation chart or a Funnel chart. Below, the Vertical Equation chart in the lower left seems unbalanced; the resulting circle is much larger than the input circles.
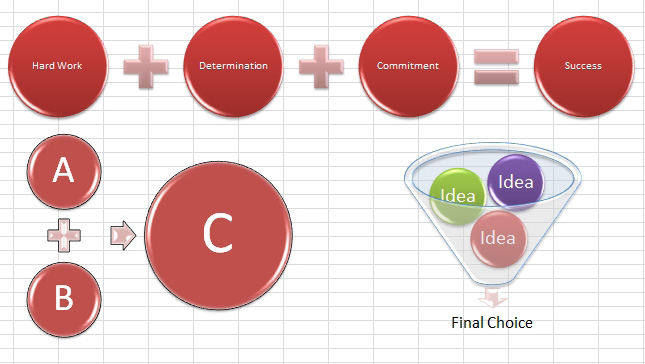
- The Funnel chart is limited to three items and a result.
To illustrate two opposing forces, you use Diverging Arrows, Counterbalance Arrows, Opposing Arrows, Converging Arrows, and Arrow Ribbon charts. These are found in the Relationship category.
Many process charts can be used to illustrate a single process that progresses from left to right or top to bottom. However, to illustrate many vertical processes in the same diagram, you use the Chevron List chart.
Some of the process charts will snake through rows and columns. If you have many shapes to fit in a small area, check out the Basic Bending Process, Circular Bending Process, Repeating Bending Process, and Vertical Bending Process charts. Below are 16 shapes in a Circular Bending Process chart. This chart has been rendered in the Brick Scene style.
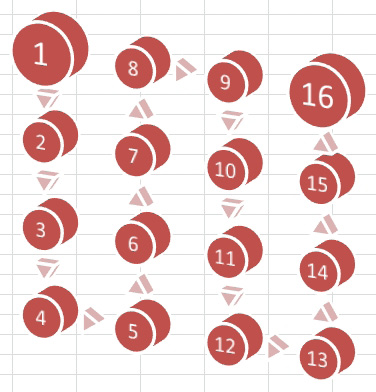
- The bending layouts can fit many shapes in a small space.