
Problem: I created a chart in Excel 2010. I want to format the chart. Where do I begin?
Strategy: There are two galleries on the Design tab. The Chart Layouts gallery will offer four to twelve thumbnails depending on your chart type. These are twelve thumbnails out of 50,000 possible ways to format the chart. At best, you might be able to find a thumbnail that gets close to what you want.
There are a few really good thumbnails. If you have a column chart, the eighth thumbnail creates a histogram. Most people can not find the Gap Width setting to create this type of chart.
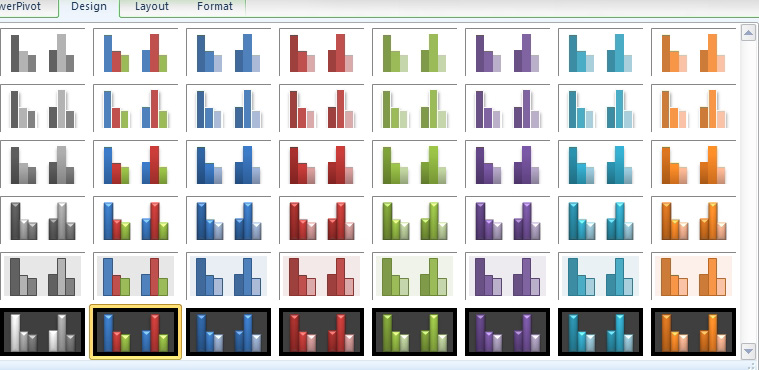
Next, the Chart Styles gallery offers 48 formats for your chart. Column 1 provides grayscale charts which are good if you have a monochrome printer. Row 6 provides dark backgrounds which work great with PowerPoint. Column 2 offers multi-color charts. Columns 3 through 8 offer shades of the six theme colors.
- Choose from colors on the Styles gallery.
Additional Details. You can choose new sets of complementary colors by using the Theme or Color dropdown on the Excel 2010 Page Layout tab.