
Problem: The VP of sales wants to stop accepting small orders. I need to see how many orders are "small" orders and the impact to our revenue.
Strategy: Build a pivot table with the invoice amount in the row labels. In order to get a count of the number of invoices, move any text field to the values area. Add invoice amount a second time to the values area. You will get a pivot table that looks like this.

- Arrange fields opposite of normal, numbers in the row labels and text in the values area.
Switch from Compact Form to Tabular form so you can see a real heading in A3. This is in the Report Layout dropdown on the Design tab.
Rename each field to Invoice Size, Number of Invoices, Total Revenue.
Select cell A4 and click Group Field on the Options ribbon tab. Enter starting, ending, and step values. Perhaps from 0 to 30,000 in 5000 dollar increments. Click OK.
Result: a pivot table version of a frequency diagram, without ever having to figure out the FREQUENCY array-function.
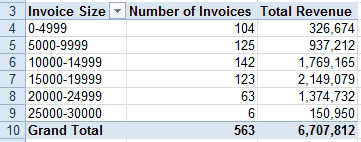
- A frequency distribution.